OpenTelemetry Tracing in Updatecli
Posted April 1, 2026 by lpostula ‐ 1 min read
Updatecli now supports OpenTelemetry tracing. Set one environment variable and you get a full trace of every pipeline run — sources, conditions, targets, and HTTP calls to external APIs.
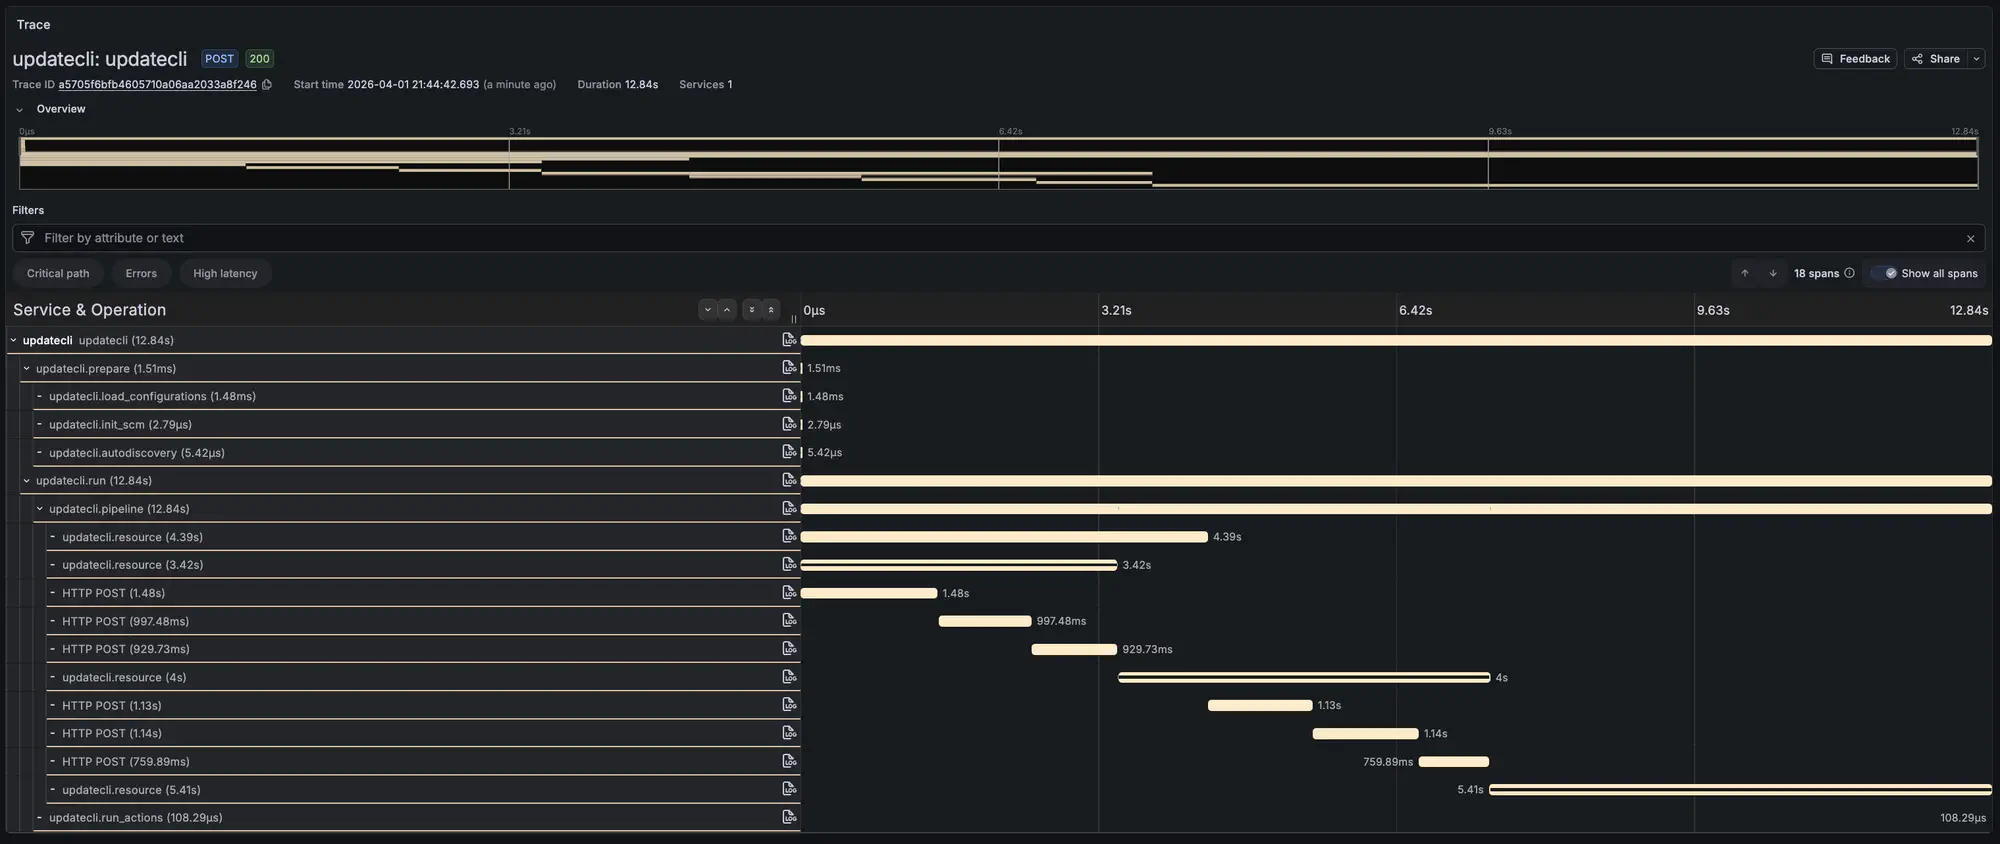
The trace above shows a pipeline diff run. You can see the prepare phase, a single pipeline with its resources, and the individual GitHub GraphQL calls. Most of the 12 seconds is network time.
How to use it
Point OTEL_EXPORTER_OTLP_ENDPOINT at any OTLP-compatible backend:
OTEL_EXPORTER_OTLP_ENDPOINT=http://localhost:4317 \
  updatecli pipeline diff --config manifest.yaml
That’s it. No flags, no config file changes. If the variable is not set, tracing is disabled and there is no overhead.
Works with Jaeger, Grafana Tempo, Datadog, Honeycomb, or any other OTLP backend. For a quick local setup:
docker run --rm -p 4317:4317 -p 16686:16686 \
  jaegertracing/all-in-one:latest
Then open http://localhost:16686.
What you get
Each span carries attributes like pipeline name, resource kind, result status, and changed files. HTTP requests to GitHub, Docker registries, and Helm repos show up automatically with method, URL, and status code.
Errors on spans are sanitized — URL-embedded credentials get stripped before reaching the backend.
Full reference in the Telemetry documentation.